Applied Productivity Apps, Tools and Methods
There are different uses of productivity tools totally in Microsoft Offices. There are usages of the following: Encoding, Apply Mail Merge, add custom animation, hyperlink, insert images in word processor and use of advance formula in spreadsheet.
Productivity Tools
It’s the software that users use to make documents, presentations, databases, charts, and graphs.
You may use productivity tools to create high-quality documents, presentations, graphics, and more.
Common Productivity Tools in MS Office
1. Microsoft Word
2. Microsoft Excel
3. Microsoft PowerPoint
Microsoft Word
The most widely used word-processing office application in the world, utilized by students, teachers, IT professionals, and businesses.
It used to make and edit professional-looking documents including resumes, books, admission forms, letters, papers, reports and booklets, cover pages, notes, assignments, brochures, and even web sites.
Features:
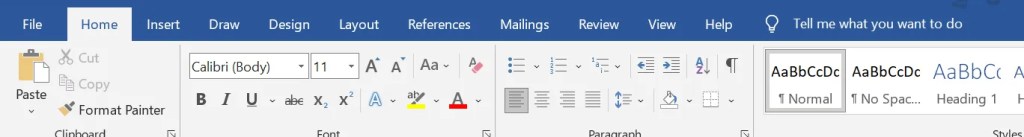
- Template
- Clipboard
- Font (Color, Size, Style)
- Paragraph
- Styles
- Editing View
Letters
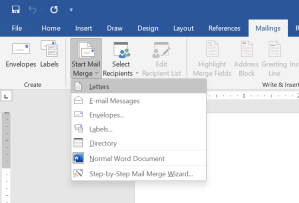
Microsoft Word lets you produce everything from a basic office memo to mail-merged form letters with hundreds of addresses.
When you type a business letter, special code in the software detects it and displays a guidance to assist you style the letter appropriately.
Envelopes
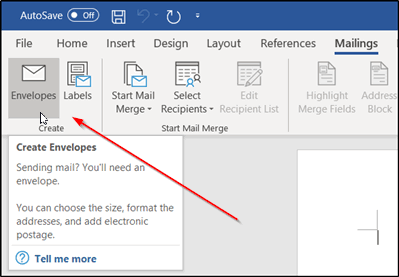
Envelopes can be made, or Word can read a letter you wrote into the application, retrieve the address information, and make a matching envelope automatically.
To make shipping easier, an address bar code can be placed to the envelope.
Format
-Header & Footer
-Headings, Subtitles
-Cover Page
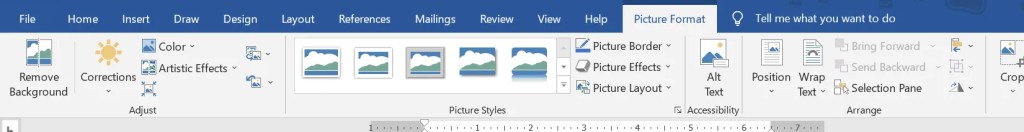
-Picture (format, arrange)
-References
-Drop Cap
-Table of Contents
-References
-Page Border, Color & Watermark
Microsoft Excel
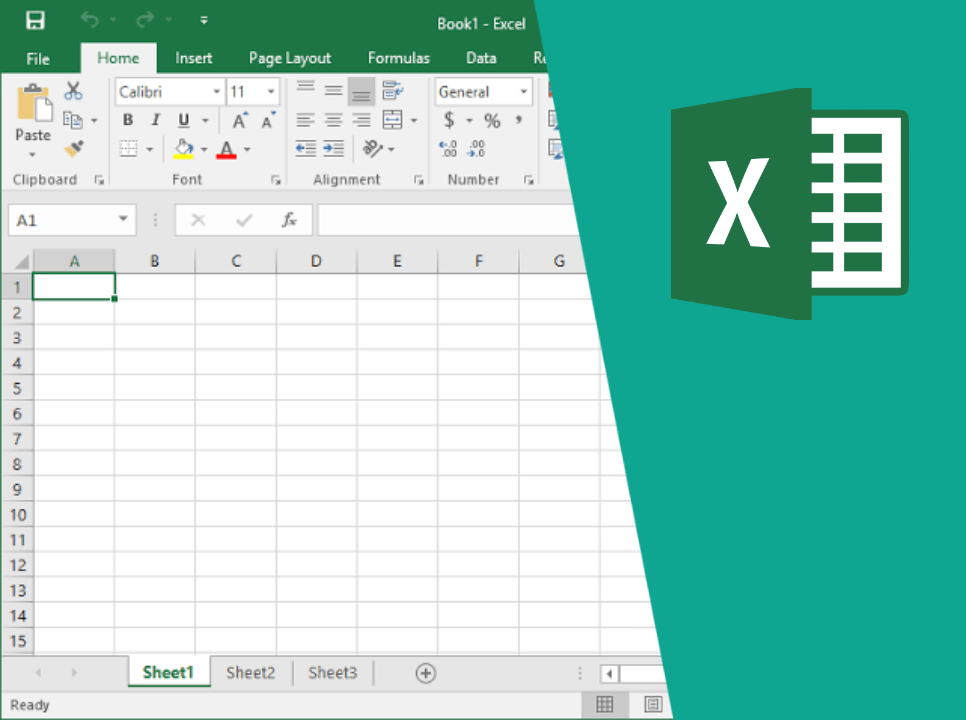
Originally, electronic spreadsheet programs were based on accounting spreadsheets. As a result, the basic layout of computerized spreadsheets is identical to that of paper spreadsheets. Tables are collections of small rectangular boxes or cells grouped into rows and columns that store related data.
A rectangular table or grid of rows and columns appears when you look at the Excel screen – or any other spreadsheet screen. Each worksheet in current versions of Excel comprises nearly a million rows and more than 16,000 columns, necessitating the use of an addressing method to keep track of where data is located.
Features
Graphical Features
• Charts: Charts can be used to represent data in a richly displayed graphical format.
• Shapes: We can use many shapes to represent data in shapes and infographics.
graphics. With Excel’s free form tool, we can design whatever shape we want.
• SmartArts: We can utilize SmartArt to graphically align data in creative ways.
transmit the information
• Clip Arts: We can provide ready-to-use clip arts to visually represent our message.
• Pictures: Any image can be used to improve the things. Worksheet, Shape, and Chart background examples.
Database Features
• PivotTables: We may use Summarize to design powerful cross tables.
•Slicers: In Excel 2010, Slicers were added, allowing us to connect numerous pivot tables and filter data with buttons.
•Tables: We can make tables from records and fields in the data. This will make it easier to conduct additional research rapidly.
•Database: To store the 1 million records, we can utilize Excel as a database. We can connect to check databases and import data into Excel.
•Sorting: In Excel, we may sort the data. With one or more columns, we can sort Ascending or Descending.
•Filtering: We can use Excel to filter the data. To filter with the required options, we can set a range of options. Advanced Filtering in Excel allows you to perform more complex filters.
•Data validations: The Data Validation Feature allows you to limit the type of data that can be entered into a cell. We could also provide a drop-down menu from which to choose from a pre-defined list.
•Grouping: With parent and child records, we can group the rows and columns.
Arithmetic Operations
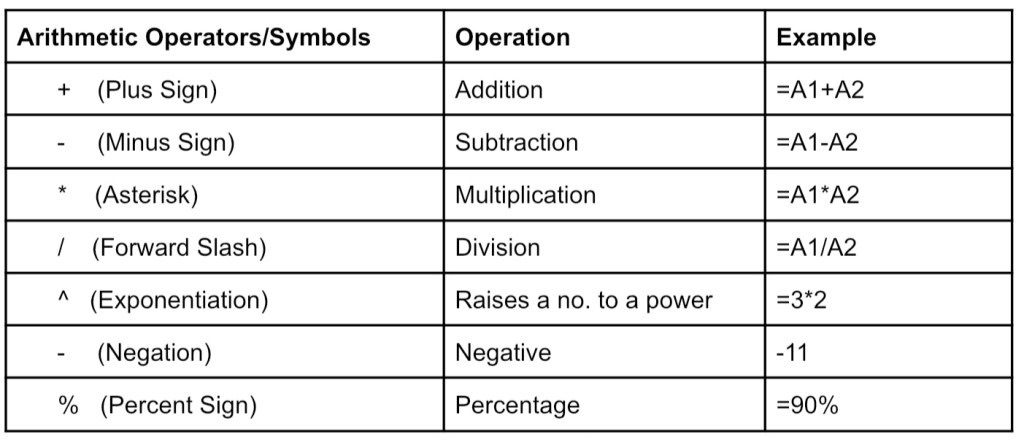
Formula– is a mathematical expression that operates on worksheet data. In Microsoft Excel, every formula starts with an equal sign (=).
Microsoft Powerpoint
Features:
• Slide Master
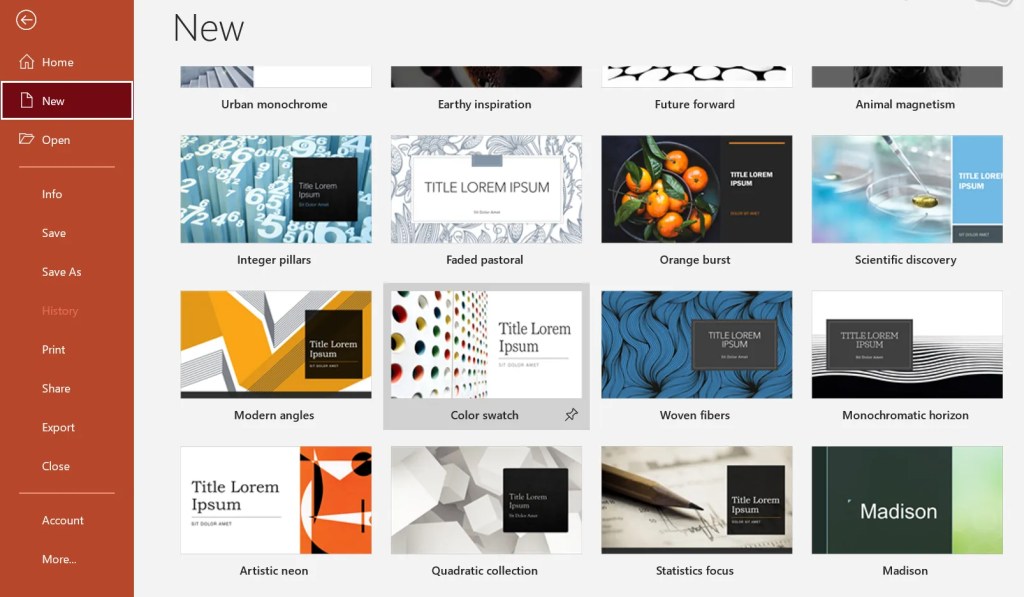
• Design
• Transition
• Animation (Entrance, Emphasis, Exit, Motion Path)
• Animation Pane
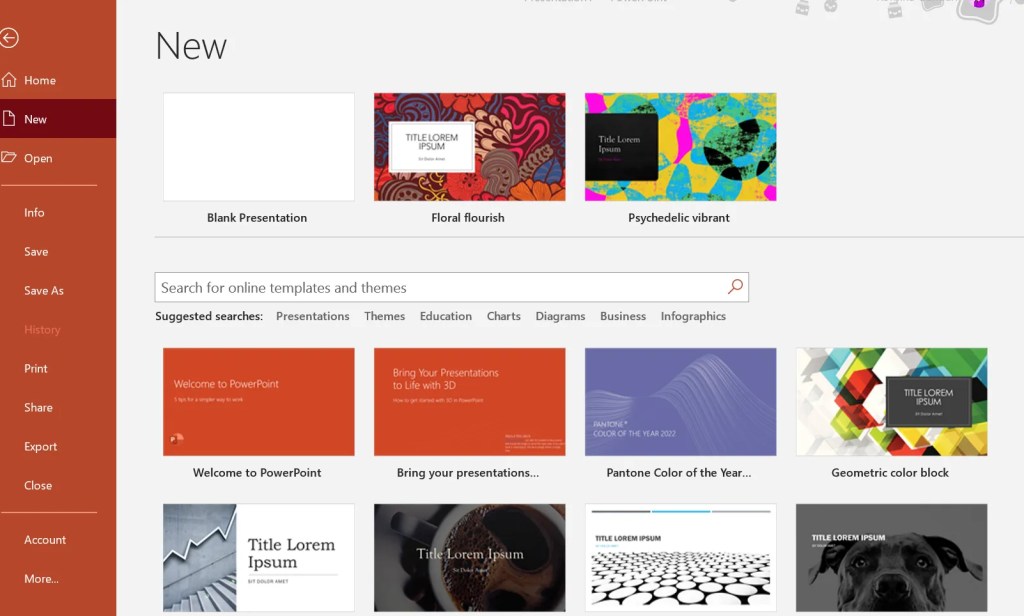
Creating a Presentation
• 24 is the default font size
• Dark background = Light text
• Light background = dark text
• Color scheme
• Animation & Transition should be on point
Custom Animation
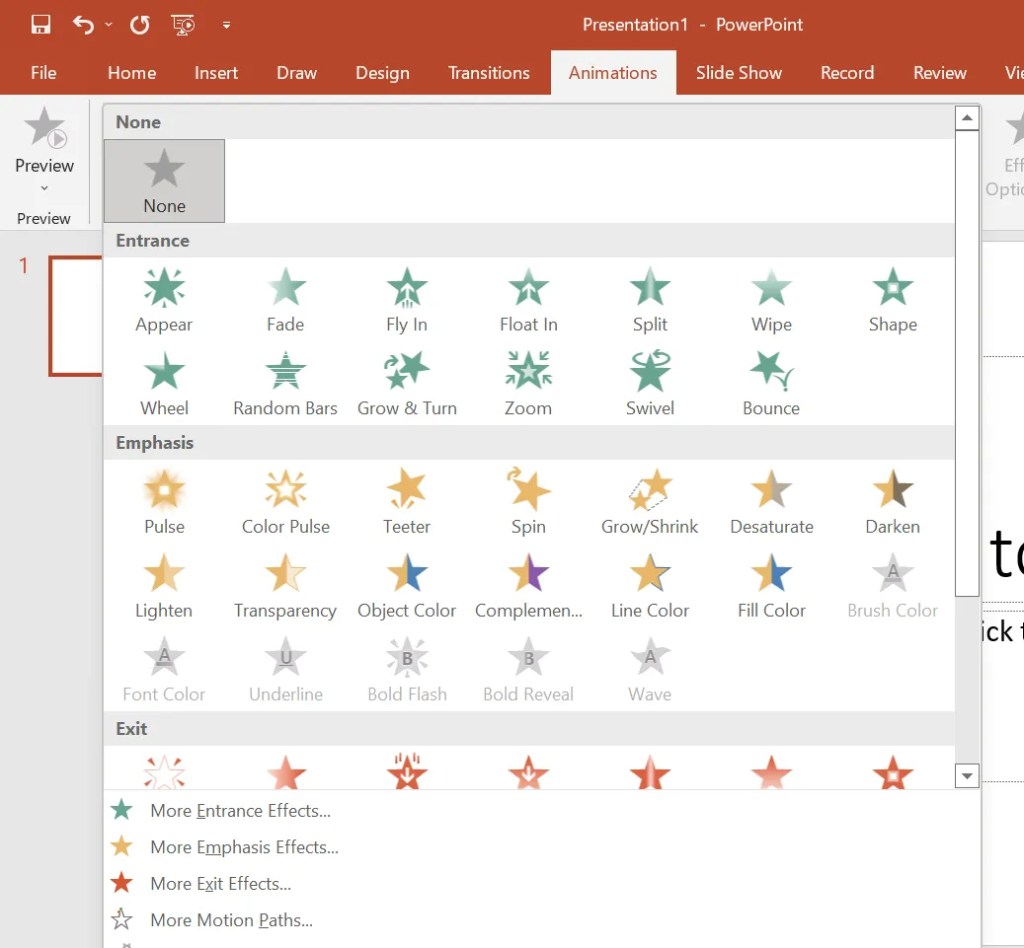
Animation is a movement simulation made by presenting a sequence of images, or frames. One of the most important components of multimedia presentations is computer animation. Many software programs exist that allow you to create animations that can be viewed on a computer monitor. You can use MS PowerPoint to build a slide show for your presentation.
Creating an Effective Presentation
• Minimize – keep the number of slides to a minimal to keep the message clear and the audience engaged.
• Clarity – avoid becoming too fancy by adopting a simple font type. Make certain that it is also simple to read.
• Summarizing – summarize the information on the screen. Limit your material to six pages. The 6X7 rule refers to lines with seven words each line.
• Visuals – employ graphics to aid in your presentation, but don’t overdo it to the spectators.
• Consistency – make your design consistent. Different font styles and backgrounds should be avoided.
• Contrast: put a light font on a dark backdrop or the other way around. In most cases, a dark background makes it simpler to read on the screen.
Hyperlink

A hyperlink, or simply a link, is a piece of information that the reader can follow immediately by clicking or touching. Hyperlinks can be found on practically every online page, allowing users to go from one page to another by clicking on them.
Hyperlinks in the text are frequently blue and underlined. The arrow cursor should transform to a little hand pointing to the link when you move the cursor over a hyperlink, whether it’s text, a button, or an image.
Using Hyperlinks in MS PowerPoint
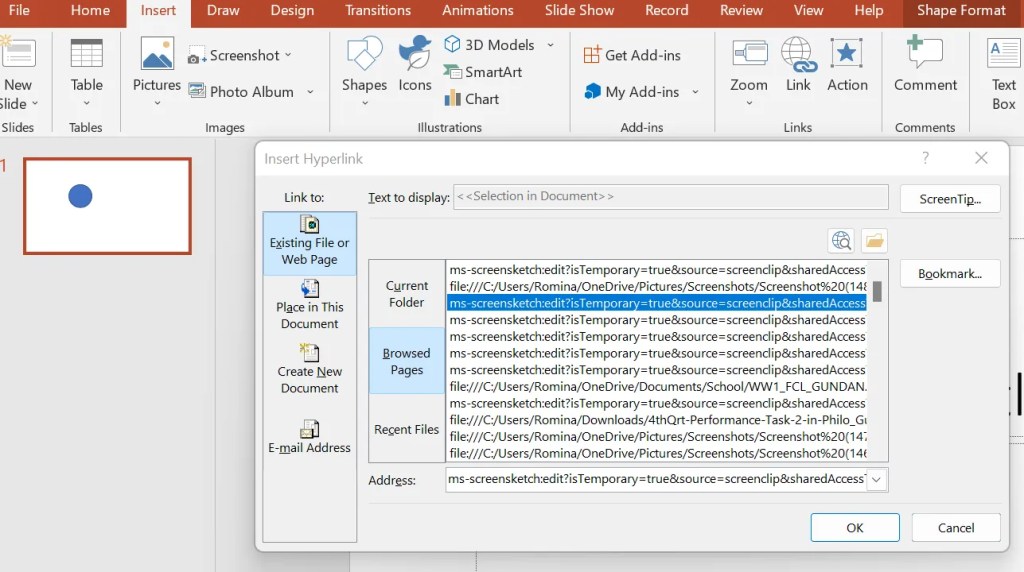
1. Select an object or highlight a text.
2. Another way is, go to Insert, click Link then Hyperlink
3. When done, click OK to apply your hyperlink.
The technology you use impresses no one, The experience you create with it is everything
Sean Gerety
